In this section I am going to cover resources (CPU, Memory, Disk and Network) both monitoring them and managing them, from the monitoring point of view we will be using both tools from vSphere client as well as vCenter and trying to find if problems relate to the virtualization layer or the guest OS. In the management section I will be discussing resource parameters and resource pools and how you can cap, or limit and also guarantee a minimum, or reservation of either CPU or memory to a VM or a resource pool.
Resource Monitoring
It is very tricky to identify bottlenecks in a virtualization environment as there can be many VM's, there are a number of 3rd party tools that you can use to monitor your environment and I use these tools to monitor the guest OS (I personally use MRTG). For the ESXi servers i use VMware own performance monitoring tools in vSphere client and vCenter. There are a number of new features with the latest release
- VMware performance counters added to Performance Monitor
- Massive increase in the number of alarms
- Better condition statements for alarms
- A frequency option to determine how you receive emails, once or repeatedly
- An acknowledgement feature to confirm that the alert has been dealt with
- vmkusage-style performance charts
- Coming soon, VMware vCenter AppSpeed, a virtual appliance that assists in monitoring performance
When looking for bottlenecks you must keep an open eye on both the virtual machine and the guest OS (this includes the running applications inside the guest OS), make sure that you still use the tools inside the guest OS, for example in windows use the task manager and in Linux/Unix use the tools like top, vmstat, iostat, but bear in mind that this tools were designed for running on physical server, all I am saying here is use all the tools available to you before you start point the finger at the virtual machine.
vCPU
I am now going to cover how the VMKernel allocates resources to the VM's, I will be covering CPU, memory, disk and networking, I have already touched on disk performance with multipathing and networking traffic shaping in other sections.
Some issues involved in CPU resource allocation are VMKernel load balancing and scheduling, the number of virtual CPU's in VM's, hyperthreading and the use of virtual SMP.
| VMKernel Load Balancing and Scheduling |
VM's execute their instructions on a physical CPU within the ESXi server, the VMKernel will monitor the load on the CPU's looking for a CPU that is doing less work. If a CPU is heavy burdened it will reschedule that VM's threads to execute on another less busy CPU. This monitoring is configured at intervals of every 20 milliseconds, this can however be increased to make it less frequent you feel your CPU load across an ESXi server is relatively uniform.
The scheduler is designed to distribute CPU requests intelligently within the ESXi server and reduce contention (two VM's fighting over CPU resource) as much as possible. |
| Single vCPU's v Multiple vCPU's |
A single-vCPU VM executes its threads on a single physical socket (or core), where as a dual- or quad-vCPU VM executes its instructions on more that one physical socket or core. VMware FT currently only supports VM's with just one vCPU, also the more vCPU's you give a VM the harder it is for DRS to find an opportunity to perform a VMotion migration to move the VM to a better ESXi server. Having plenty of sockets or cores to run is sometimes referred as slots, the fewer the slots an ESXi server or DRS cluster has the fewer VMotion events take place. |
| Hyperthreading |
If you are using hyperthreading the VMKernel treat each logical CPU as if it was physical CPU, so a two-socket processor with hyperthreading enabled would appear as if it had four processors. When it comes to dual-vCPU and quad-vCPU VM's, the VMKernel scheduler always makes sure it runs the VM on two different logical processors in two different processors.
The new Intel processors have been overhauled with new version of hyperthreading on version 3 which has improvements of up to 30%.
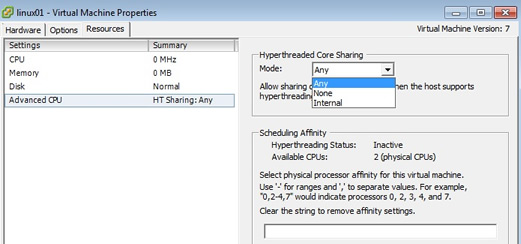
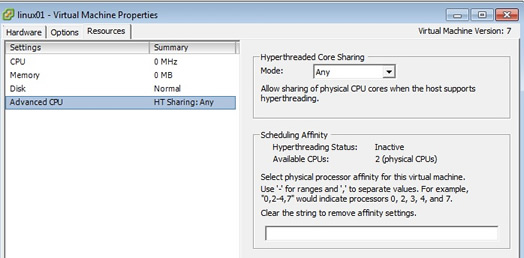
Under the Advanced settings on a VM, you can chose from three modes options
- Any - More than one VM can execute on the logical CPU (default)
- None - VM receives all the CPU not shared with other VM's
- Internal - VM's with two vCPUs gets exclusive access to a CPU and its logical CPUs
You can also select the processors to use, using scheduling affinity (see below image)
|
| Virtual SMP |
To get the benefit of virtual SMP you need to have plenty of sockets and cores. Simply put the more sockets and cores you have the easier the VMKernel scheduler has of finding a CPU not in use or not heavy in use. Note however that the application still has to take advantage of SMP, otherwise you may not see any performance improvement.
|
If you have P2V a physical machine, the guest OS may need a kernel update to either downgrade or upgrade its processor requirements, for example in the world of windows a kernel update means changing the ACPI function for a ACPU multiprocessor to a ACPI Uniprocessor within the device manager, newer versions of Microsoft will do this for you but older versions will require a manual process, keep an eye on a newly P2V servers and double check if you do need to update the hardware abstraction Level (HAL).
Memory
The balloon driver and the VMkernel VM swap file affect the allocation of memory to your VM. If you run more than one copy of Windows or Linux, the VMkernel can identify that very similar information is likely to be duplicated in memory (for example explorer could be running in multiple windows VM's). The VMKernel spots these duplicates and produces a single read-only copy, this attribute prevents the possibility of one VM modifying the memory contents of another VM. The sharing of memory pages will remain invisible to all the guest OSs inside the VM's. VMware's own research has found that around 30% of guests OS are duplicated between VM's, this memory sharing is known as Transparent Page sharing (TSP).
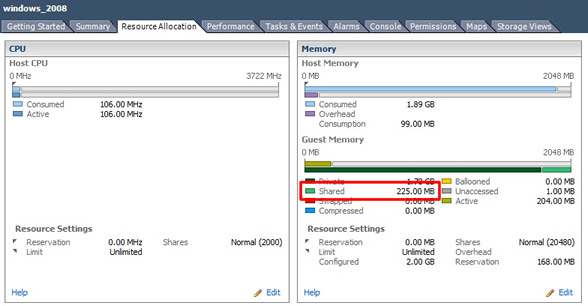
You can clearly see TPS in action on the resource Allocation tab of a VM if you look at the memory panel and the shared parameter, here you can see my Windows 2008 server is sharing 225MB of memory with other VM's.
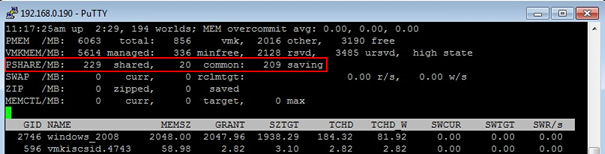
You can also use the esxtop command to see what you are sharing, when you first start esxtop it will display CPU usage, type m to display memory usage.
When you install VMware Tools into a VM, a memory driver is also installed, its file name is vmmemctl, but is it also known as the balloon driver, because it uses the analogy of a balloon to explain how this driver works. This driver is only engaged when memory is scarce (when contention is occurring), it inflates by demanding pages of memory from other VM's (these may have low priority). The guest OS obeys its internal memory management techniques, freeing up RAM by flushing old data to its virtual memory (paging file or swap partition) to give the vmmemctl driver ranges of memory, rather than hanging on to this newly allocated memory, the vmmemctl driver hands it over to the VMKernel, which itself hands it over to the VM's that require it. When the demand has returned to normal the balloon driver deflates and gracefully hands back the memory it claimed to the guest OS.
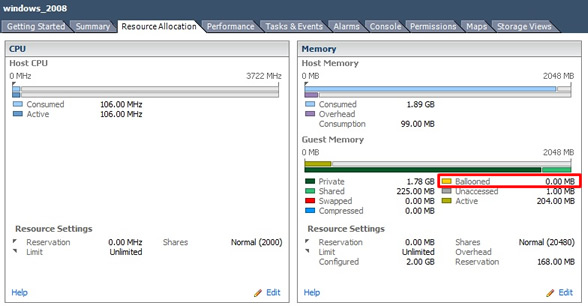
You can see the ballooned memory on a VM via the resource allocation tab in the memory panel, as I have a quiet system there is no ballooned memory.
The VMkernel VM swap file is only used when a VM's has used all of its allocated virtual memory (as a last resort). You can see the swapped memory in the image above in the memory section. I will discuss the VMKernel swap file in much more detail in my resource management section below.
Below is a table on what to look for when you looking for performance problems and using the performance charts in vSphere client or vCenter
| CPU |
Use to the ready value to get a more actual performance value from a VM. The ready value means the VM is ready to execute processes and is waiting for the CPU to allocate a slice of CPU time. Make sure that its ready value is low (<5%) if not then it means the VM is ready to run but the CPU is not ready to supply the CPU time it demands. |
| Memory |
As mentioned above look for any swapping or ballooning which will indicate a memory shortage |
| Network |
There is a close relationship between network activity and physical CPU usage, this is because the load-balancing mechanism of the IP hash in itself causes the VMKernel to use the physical CPU. Lots of small TCP transactions inside a VM can cause the physical CPU to be busy, as the VMKernel needs to move packets from the physical NIC to the virtual NIC via the vSwitch.
Make sure that VMware tools has been installed (installs a virtual networking driver) and make sure that if traffic shaping has been setup that it is correct (it could be throttling bandwidth). |
| Disk |
Internal tools of the guest OS can help here as well, as VMFS is so lightweight that it can be disregarded as the source of a bottleneck. Look at multipathing and make use you use the best method (round-robin?). Also look at memory if exhausted then the VM may be paging or swapping thus producing disk performance problems.
When looking at the charts look for "Kernel disk command latency" which indicates the time on average that the VMKernel spent on each SCSI command (<2-3ms). Secondly look at "Physical device command latency" which measures the average time a physical device took to complete the SCSI command (<15-20ms). |
Performance Charts
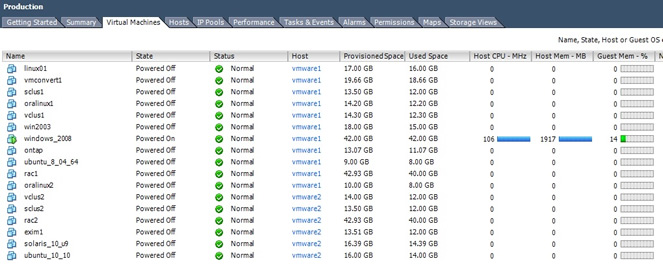
Both vSphere client and vCenter have graphical charts, vCenter does have extra feature which allows you to go back in time. For the rest of this section I will be using vCenter, the first place you can look is the "virtual machine" tab on one of your folders, in my case I selected the "Production" folder, here you can have a quick glance of all VM's that are running, you can see CPU and memory resources that are being used
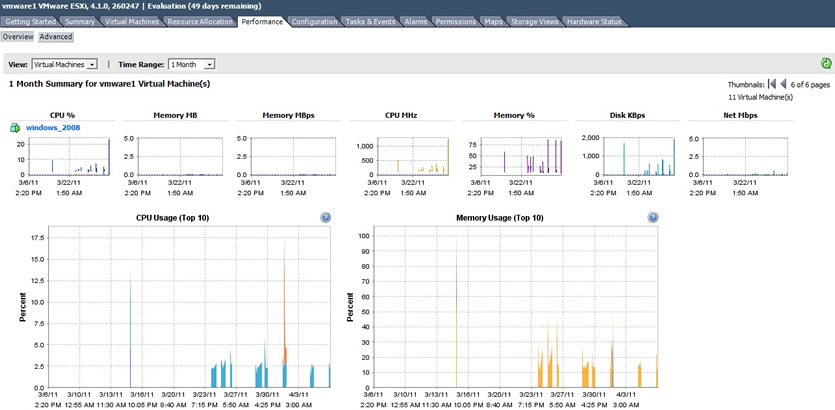
But if you really want very details performance information then we have to go to the performance tab (see image above), I am only going to gloss over these as you will be the ideal on what is available and what you have access to regarding the performance charts. The image below show you the overall performance of a particular ESXi server with a number of VM's, the information displayed is of a Windows 2008 Server but you can display all the VM's, you can also adjust the time range (you cannot do this on vSphere client), I have selected one month. You have CPU, Memory, Disk and networking information all on one screen.
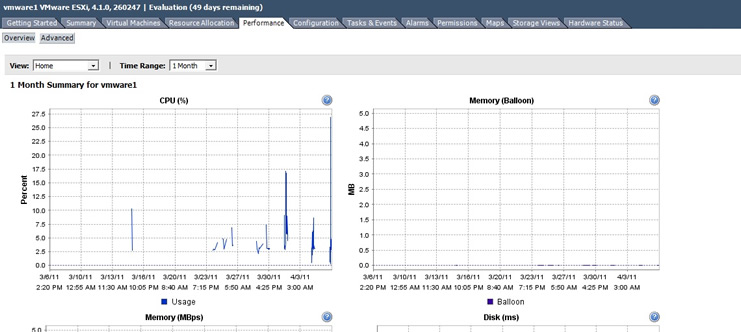
The home screen view gives you information on the ESXi server itself, it is an ideal screen to see if your DRS is working correctly, hopefully all ESXi server should utilized evenly.
Lastly you can drill right down to each component, each ESXi server and each virtual machine as a chart like this, just select the ESXi server or virtual machine and then select the performance tab.
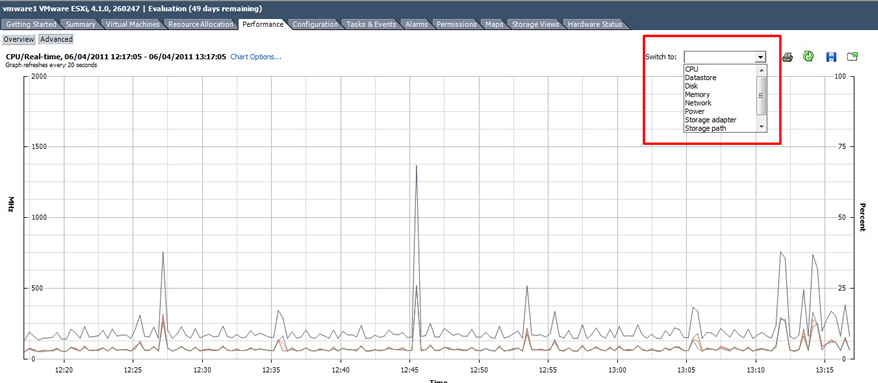
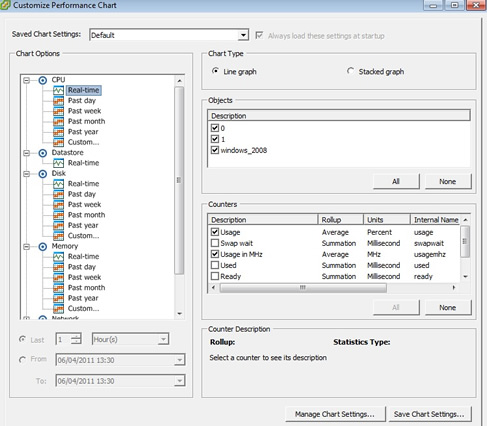
You can even customize the chart and there are many options, line or stacked graphs, turn different counters on/off, different time periods including custom ones.
Alarms
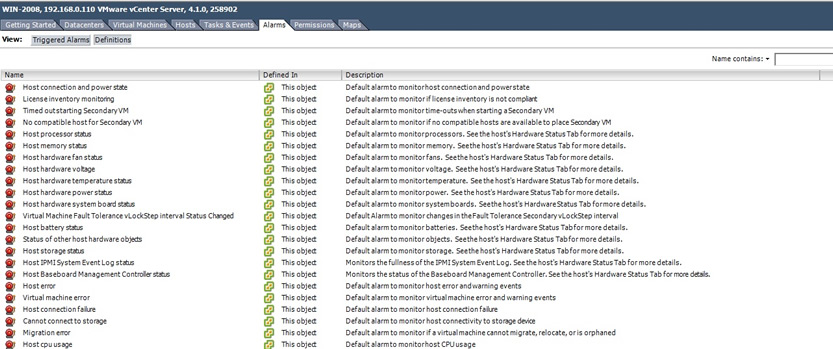
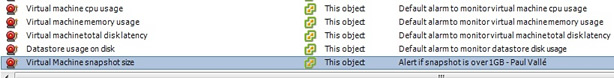
Personally I try and use a 3rd party software tool to manage monitoring (HP openview), opening up each area's software would be a real pain, however for completeness I will show you briefly what VMware has to offer, In the latest version you can now have alarms on datacenters and clusters, and most of the important alarms are turned on by default. The built-in alarms and alerts at the top of the Inventory in Host and Clusters are inherited down the inventory and applied to all ESXi servers and VM's. The below image identifies a small number of them,
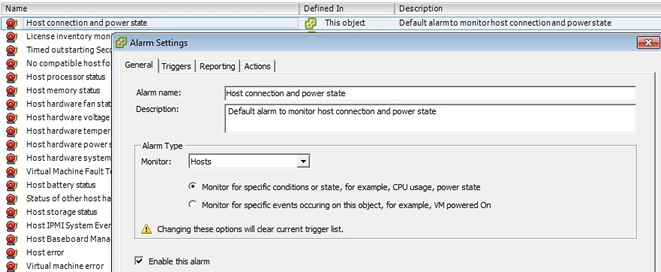
You can modify a resource by right-click and selecting "edit settings", here you have four tabs which are self explaining, you can also enable or disable the alarm (see bottom left hand corner).
To create an alarm follow below
| Create an alarm |
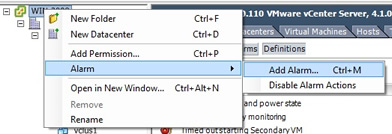
This alarm will filter down to all hosts as it will be at the top of the hierarchy, from the top folder (win_2008 in my case), right-click and select alarm -> add alarm
Fill in the alarm name and description with something meaningful, make sure the alarm is enabled at the bottom
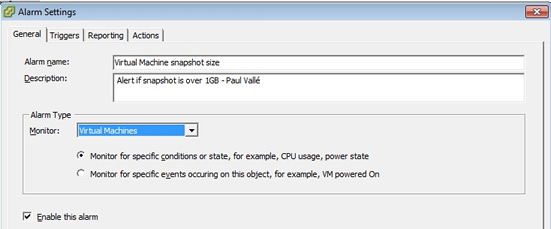
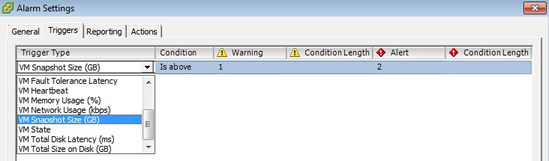
In the triggers tab, select add, then the line has drop down lists that you can choose what options you want, I am setting up an alarm to email me when a snapshot file is greater than 1GB
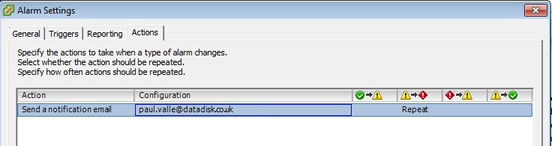
I then select the action tab so that the alarm will email me, again it is the same as above, the line has drop down lists that you can change
Finally the alarm is created and ready to go
To remove it, just right-click and select "remove".
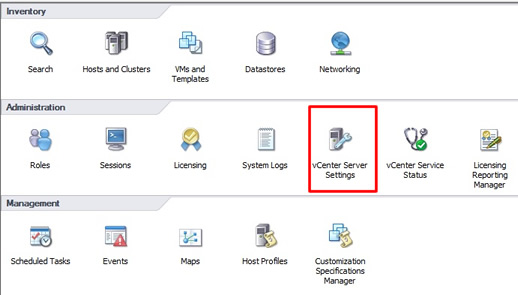
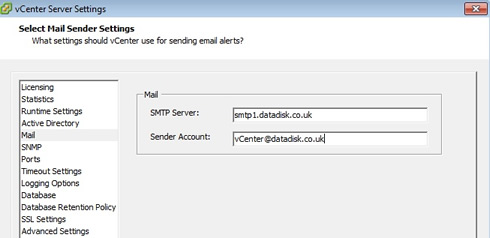
If you have not already configured mail within vCenter, then follow the steps below, first open the "vCenter server settings" from the home page
Then select the mail option and fill in the SMTP server details and sender account details, then you can test the alert above by increase a snapshot to over 1GB
|
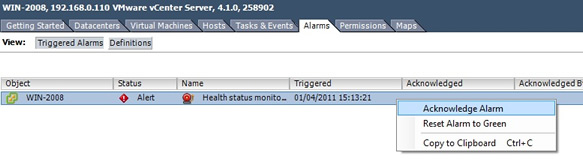
You can acknowledge alarms, by selecting the triggered alarms tab and right-clicking on the alarm, you can clear the alarm by selecting the "reset alarm to green"
Events and Tasks
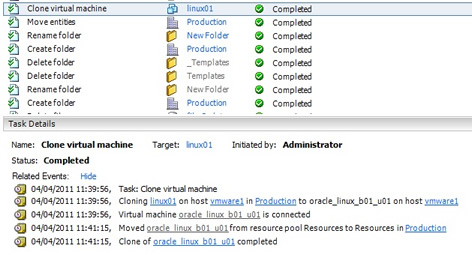
Next I want to cover viewing the events and tasks, before I move onto managing resources, the tasks and events tab is a record of all the tasks and events that have taken place, power on/off VM's, you can even see cloning, etc. This is a great source of information to see what has been happening in your environment.
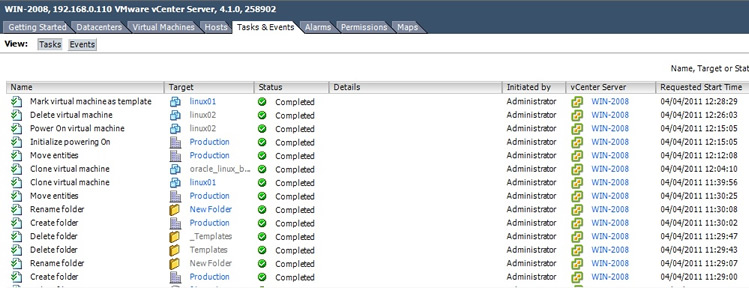
If you select the show tag at the bottom you can get a more detailed view on want went on regarding each task or event.
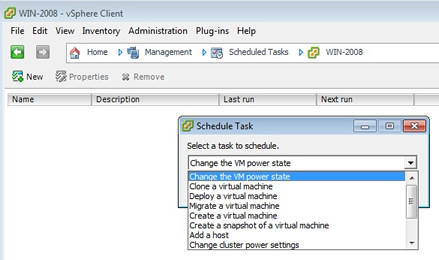
You also have the ability to schedule regular tasks, select from the home page -> management -> scheduled tasks by right-clicking on the page you can choose from a number of tasks that can be carried out, cloning a VM, migrate a VM, etc
Resource Management
You can adjust resource parameters for CPU, memory and disk on a per-VM basis or you can drop groups of VM's in to resource pools to manage their CPU or memory. Resource pools allows you to treat VM's as groups instead of individuals, and to quickly apply settings to them. You can cap or limit and also guarantee a minimum or reservation of either CPU or memory to a VM or a resource pool. VMware proportional share system provides more dynamic control over VM's resource usage, as it responds to changes in resource demand relative to each VM and ESXi server.
You can impose limits on a VM or resource pool for CPU resources (by megahertz) and for memory (by megabytes), when you create a VM you already set a maximum amount of memory, even if memory is available the VM will not allocate any more than this maximum, if all memory has been depleted it is possible for the VM to use its VMKernel swap file. In contrast the CPU has no default limit, if the VM requires CPU time and it's available then it gets it. However you can limit CPU intensive VM's by placing a cap or a limit which can then control the VM CPU usage.
VMware also uses reservations, you could even regard them as a way of meeting service level agreements (SLAs), for an example if the memory reservation on a VM is 1GB of RAM and that amount of physical RAM is not available you will be unable to power on this VM, this is know as admission control, basically if you exceed physical limits of the ESXi server you will not be able to power on the VM.
There are relationships between memory limits, reservations and the VMKernel swap file
- Difference between limit and reservation - you have a VM with 512MB limit and a 256MB reservation, powering on the VM would create a 256MB VMKernel swap file (512 -256) and guarantee that the VM would receive 256MB of RAM. The VM would not power on if there as insufficient space for the swap file.
- No difference between limit and reservation - if you set the limit to 512MB and the reservation also as 512MB and powered on the VM, ESXi would not create create a VMKernel swap file at all, it would run the VM entirely in a memory reservation of 512MB
- Big difference between limit and reservation - If the VM was given a 16GB limit and the default of 0MB was used for the reservation, a 16GB VMKernel swap file would be created, this VMKernel swap file is created in the same location as the .vmx file, which could be on extremely expensive shared storage such as SAN, you can relocate this swap file to a different location.
There are two examples below and depending if the administrator is optimistic or pessimistic regarding if the VM's will consume all the memory during a period of time, or if you want to get bang for your buck on your ESXi servers, obliviously if you are in a large corporation and cost does not come into it then you can fully load your servers with maximum amount of memory and go the pessimistic route, because I work for a small company I am in the optimistic group I try to leverage the VMKernel swap file to over commit on memory, especially if the VM's are web servers, exim (smtp) servers, etc.
| Optimistic |
if you have a ESXi server with 2GB memory you could run up to eight VM (using 512mb each (256MB physical + 256mb VMKernel swap file)) before running out of physical memory (2048MB / 256MB), if all the VM's used up all there memory (each one has to use upto 256MB each) you would get VMKernel swap activity as each VM will have a 256MB VMKernel swap file. |
| Pessimistic |
If you wish to have a cast iron guarantee that your VM's will always run in memory you would choose the second option set the VM limit the same as the reservation limit, thus no swap file will be created, so again using an ESXi server with 2GB memory you could run up to four VM (using 512mb each (512MB physical)) using before running out of memory (2048MB / 512MB), remember there will be no additional VMKernel swap file. |
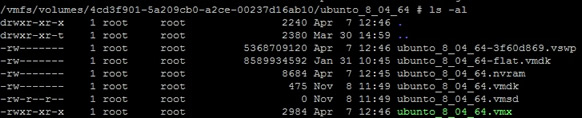
I increased my allocated memory on my Ubuntu server to 5GB, because this exceeds the maximum memory a VMKernel swapfile is created with the .vswp extension, this is how VMware over commits on memory. Remember that the VMKernel swap file is no substitute for physical memory but it may be useful for odd periods when the ESXi server is busy. Also remember that this VMKernel swap file consumes disk space, so be aware that if your VM uses large amounts of memory that you may fill up the VMFS volume, you will get a error message stating that there is no free space to create the swap file.
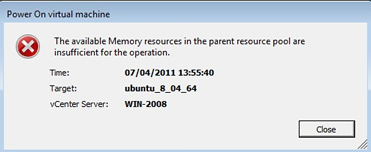
This is what happens when you do not have enough resources even to power on the VM
The proportional share system allows you to indicate that when a resource is scarce one VM or resource pool is more important than another. Share values can be applied on a per-VM basis or on resource pools, shares can act dynamically to resource demands, the share value can be specified by a number of by user friendly text like Normal, High and Low, remember though that shares only come into play when resources are scarce and contention is occurring. Many customers do not use the share system, it does require a bit on thinking to setup and to maintain, with cheap memory and CPU costs, most companies will purchase additional hardware, but when time are lean the share system can help.
You can set share values by using friendly labels, here are those values and the resources settings, VMware has placed more attention to the memory, if has lots of memory then you have lots more shares, thus memory intensive VM's should get more priority.
| High |
allocate 2000 shares per vCPU; 20 shares for every 1MB allocated to the VM |
| Normal |
allocate 1000 shares per vCPU; 10 shares for every 1MB allocated to the VM |
| Low |
allocate 500 shares per vCPU; 5 shares for every 1MB allocated to the VM |
It is possible to peg a particular VM to a particular CPU, this is known as processor affinity, normally the ESXi server dynamically move the VM to work on the best CPU. Personally I would only use this feature as a last resort and thus have not used it yet. If you select the VM then "edit settings", select the resource tab, you will find it under "advanced CPU", just select the physical CPU ID that you wish to peg the VM to, remember they start from 0.
Resource Pools
Resource pools are optional, you can have stand-alone ESXi servers and DRS clusters without resource pools, basically you accept the default which in most cases is adequate. You can only control CPU and memory resources within a resource pool, they can be created in both vSphere client and vCenter. Resource pools are ideally suited when you are using clusters where you have lots of resources that can be divided amongst the ESXi servers.
To create a resource pool follow below
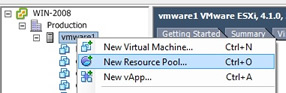
| Creating a resource pool |
Right-click on the ESXi server (or cluster) that you wish to create the resource pool
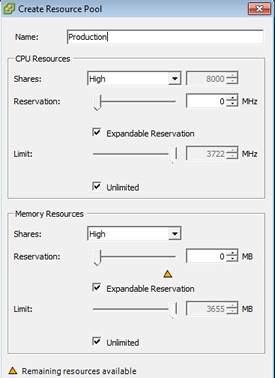
Type a friendly name, then you can adjust the resource allocation, I changed both resources to high
The resource pool will appear a a folder under your ESXi server (or cluster)
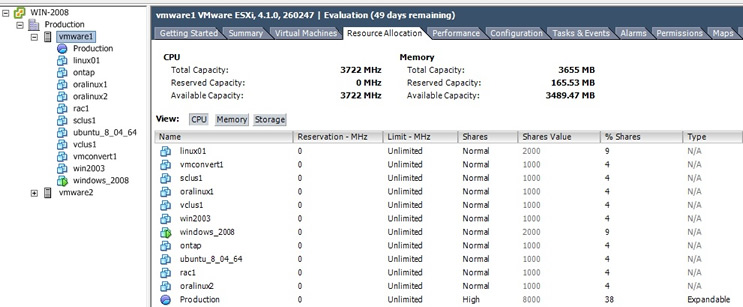
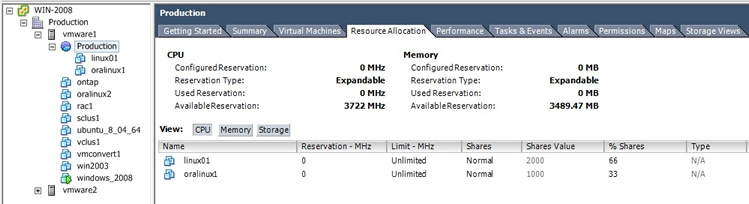
Simply drag and drop you VM's into the folder, once in the folder they will be under resource pool control, you can see that I have two VM's in my Production resource pool, and because the VM linux01 uses more memory it has a great number of shares , 2000 shares instead of 1000 shares for the other VM, this means that this VM will get more resources when the ESXi server has any contention.
To remove the resource pool, simply right-click on it then select remove |